EvapCryst logo

Industrial Crystallization Systems

Every crystallization plant is two orthogonal decisions. Dimension C decides how supersaturation is generated — evaporative, cooling, vacuum flash, reaction or hybrid, set by the solubility curve of your system. Dimension D decides how crystals grow — forced-circulation, DTB or Oslo, set by target particle size and purity. Master both and the flowsheet follows.

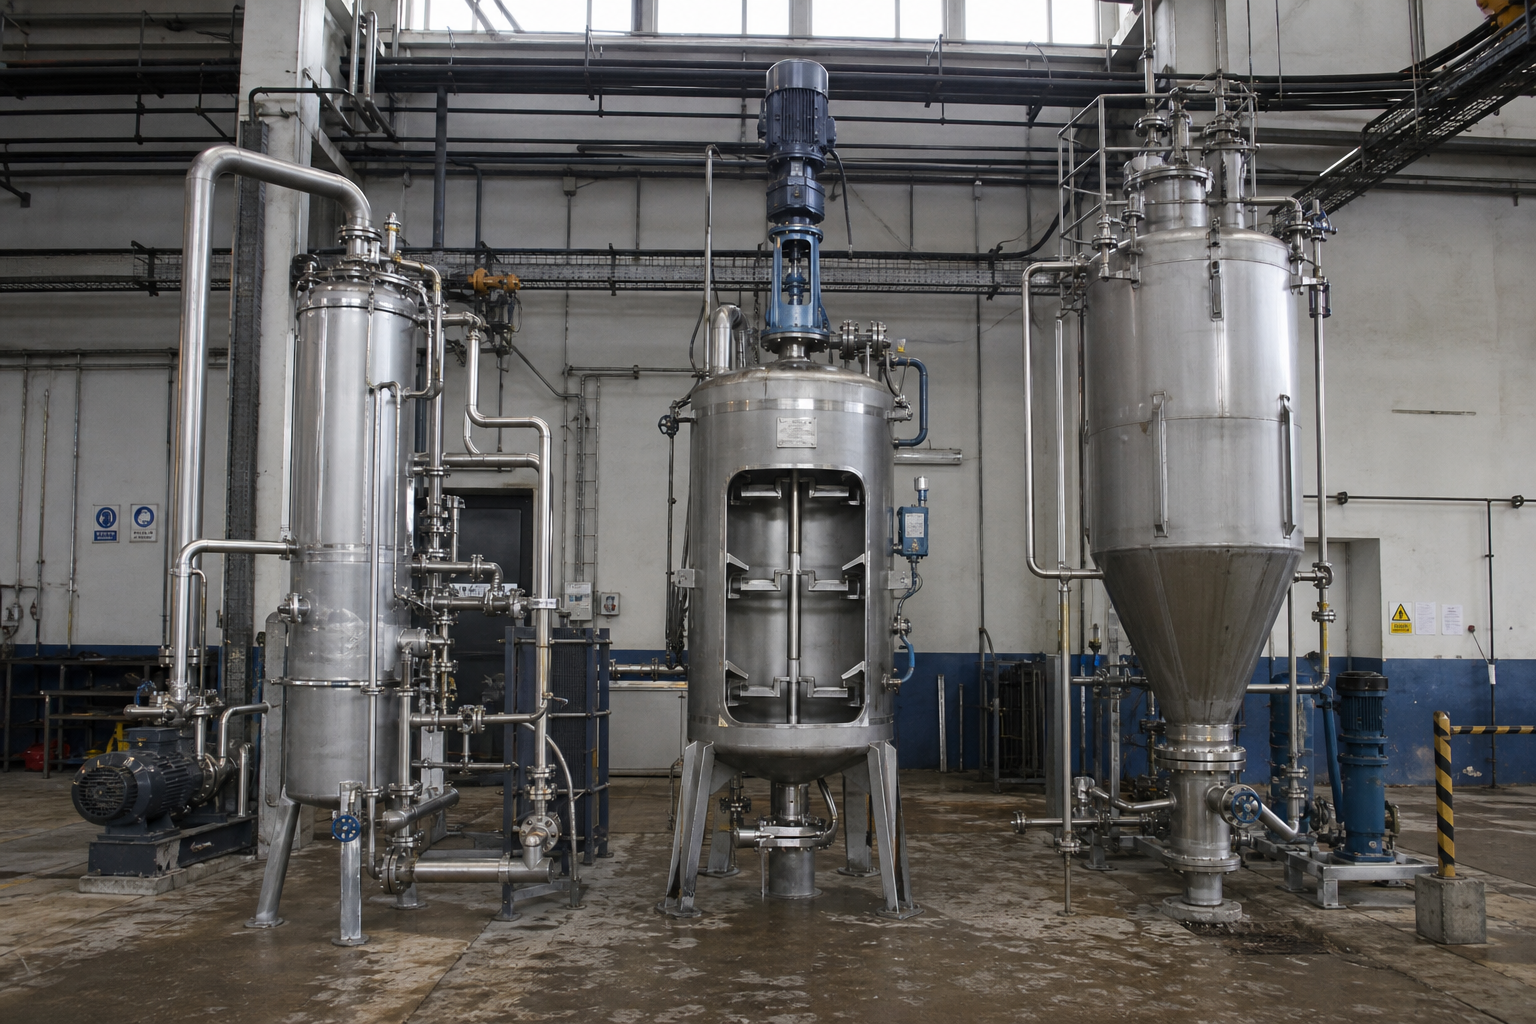
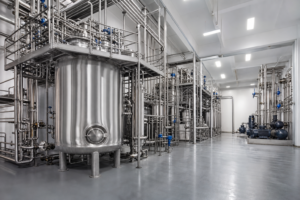
Industrial crystallization equipment for salt production from wastewater
At a Glance

Four Numbers That Define Crystallization

Reference ranges under typical operating conditions — where your project lands inside each range depends on the solubility behavior of your system in the method table and the configuration table.

Crystal Size Span
5 µm → 5 mm
from fine chemicals to coarse premium product — set by Dimension D configuration choice
Oslo Supersaturation
≤1–2 g/L
held sub-metastable in the fluidized bed — the price of 1–5 mm coarse crystals
Battery-Grade Purity
>99.5%
achievable with fines-removal configurations and controlled growth — feed-chemistry dependent
Final Free Moisture
<0.1–0.5%
<0.1% battery-grade, <0.5% fertilizer-grade — after centrifuge, wash and dryer
Working Principle

From Solution to Crystal

A crystal only grows when the mother liquor is supersaturated. The plant is an exercise in generating that supersaturation, holding it inside the metastable zone, and giving crystals time, suspension and classification to grow.

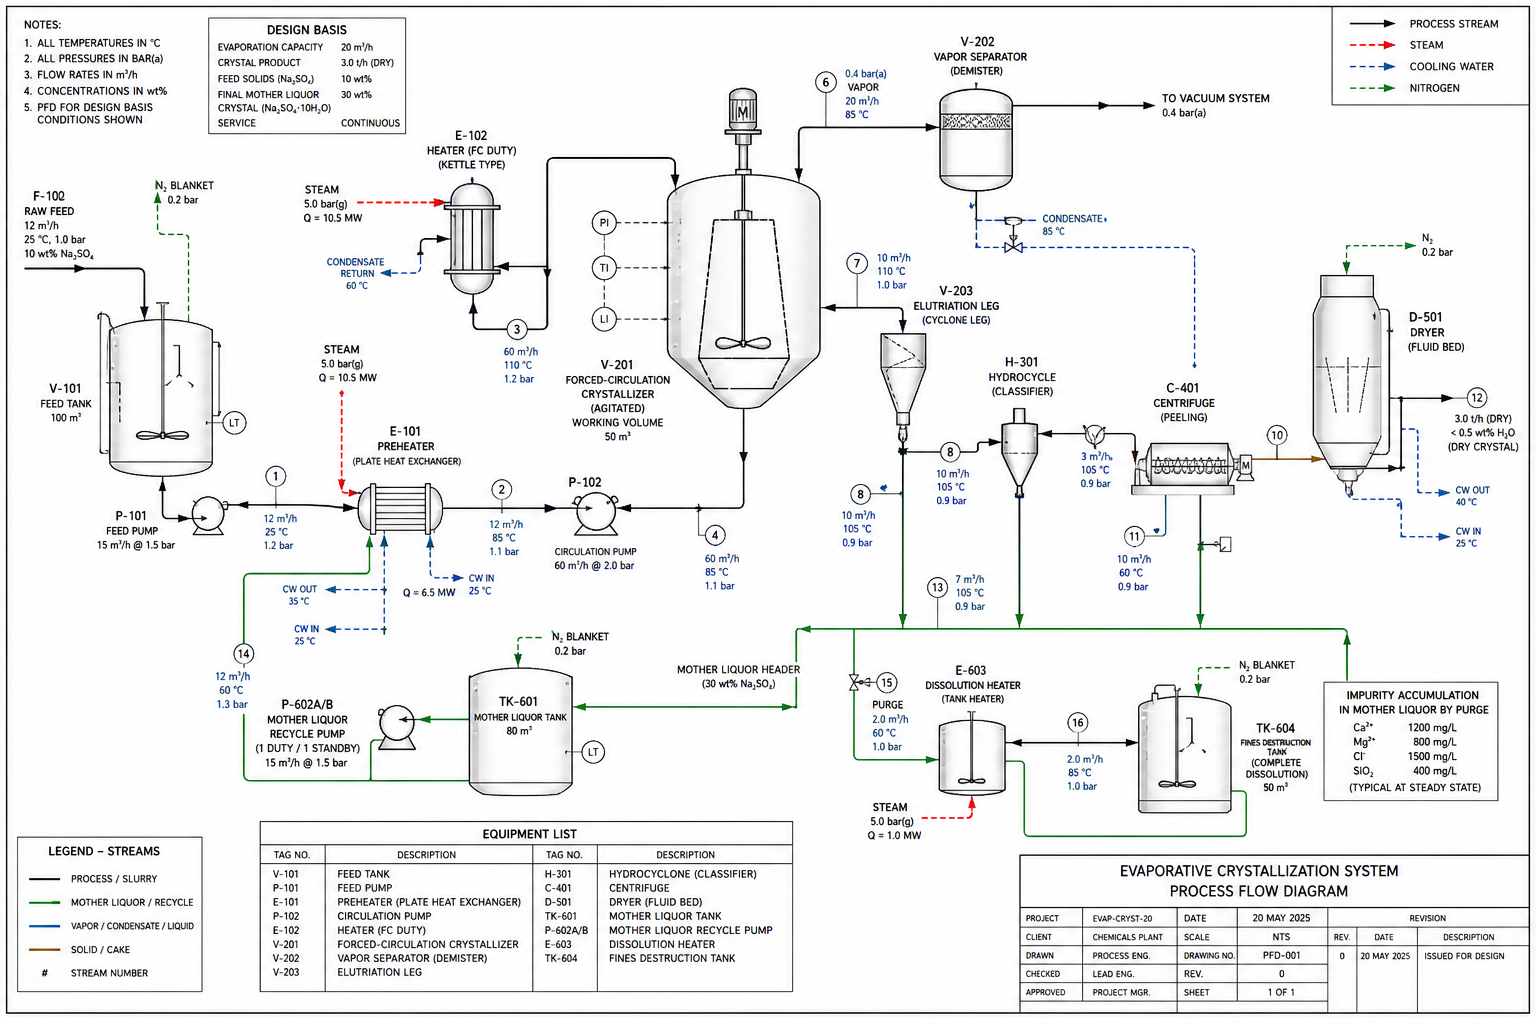
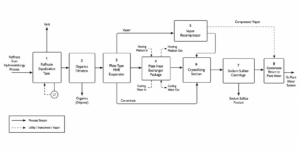
Simplified Crystallization Flow Diagram

Supersaturation is generated in a loop separated from the growth volume wherever the configuration demands it — the two functions never have to share one vessel.

01

Approach Saturation

Feed is pre-concentrated by evaporation until it approaches the saturation line — often in an MVR or multi-effect front end.

02

Generate Supersaturation

Dimension C — remove solvent (evaporative), remove heat (cooling), flash under vacuum, react reagents, or combine routes. The solubility curve decides.

03

Grow & Classify

Dimension D — FC, DTB or Oslo holds the suspension, controls nucleation and classifies product. Fines are removed or destroyed; coarse product is harvested.

04

Separate & Dry

Centrifuge and wash remove mother liquor; the dryer takes free moisture below 0.1–0.5% depending on product grade specification.

Dimension C · Supersaturation Route

Five Ways to Cross the Solubility Line

The solubility-vs-temperature curve of your system decides which route can reach the target yield — and which routes are physically closed. Method selection precedes equipment selection, always.

01 · Evaporative

Remove Solvent at Boiling

Concentrate at controlled temperature until the liquor crosses saturation. The default route where the solubility curve is flat or the feed is already hot — and the only route that works for inverse-solubility systems paired with reaction crystallization.

Flat ds*/dTsolubility weakly temperature-dependent — cooling alone cannot reach yield
02 · Cooling

Remove Heat Along the Curve

Chill the saturated liquor so solubility drops and crystals appear. Only viable where the curve is steep; per-stage ΔT is capped to stay inside the metastable zone and limit nucleation.

≤5–8 °C/stagecooling ΔT limit per stage — larger steps crash the metastable zone
03 · Vacuum Cooling

Flash Under Vacuum

Hot saturated liquor flashes adiabatically at reduced pressure — part of the solvent evaporates, the liquor self-cools. The standard route for fermentation products where any cooling surface would foul.

No cooling surfacesupersaturation forms in the bulk liquid — nothing for crystals to scale onto
04 · Reaction

Precipitate by Reaction

Two reagents meet and the product leaves solution as a solid — the only route for inverse-solubility salts such as lithium carbonate, which precipitates as carbonate meets lithium above 90 °C.

Stoichiometrysupersaturation set by reagent dosing, not by heat or evaporation
05 · Evap-Cooling Hybrid

Both Levers at Once

Evaporate part of the solvent and cool the rest of the way along the curve — used where one route alone cannot reach both the yield target and the particle-size target simultaneously.

Yield + PSDone route chases yield, the other shapes the crystal population
Decision Rule

Method Is Independent of Vessel

Dimension C (how supersaturation is generated) is orthogonal to Dimension D (how crystals grow). Any documented method pairs with any documented configuration — the pair is justified by the heat and mass balance.

C ⊥ Dorthogonal decisions — see the combination table below
Dimension D · Growth Configuration

FC vs. DTB vs. Oslo

Three configurations cover the industrial size range. Which one you land on is set by target particle size, purity spec and how much supersaturation the liquor can carry without crashing.

ConfigurationCrystal SizeFines RemovalCirculation VelocitySupersaturation LevelBest Suited For
Forced-CirculationFC
d50 0.2–0.8 mmNone — external loop only2–3 m/sHighest tolerable of the threeScaling and high-TDS brines, ZLD service
Draft-Tube-BaffleDTB
d50 0.5–2.0 mmElutriation leg + fines destruction1–2 m/sModerateFertilizer and battery chemicals with purity spec
Oslo Fluidized-BedCLASSIFYING
d50 1.0–5.0 mmClassification by fluidization0.02–0.05 m/sLowest — sub-metastable, ≤1–2 g/LCoarse premium crystals, e.g. NiSO₄

Circulation velocity and supersaturation level move inversely: FC runs fast enough to suspend through high supersaturation, Oslo runs slow with supersaturation held sub-metastable in the fluidized bed. Figures reflect typical industrial ranges observed in operating references; project-specific selection requires solubility data, target PSD distribution and purity specification analysis.

How C and D Combine

Method and Configuration Combine — Never Compete

Because Dimension C and Dimension D are orthogonal, every plant is one method from column C paired with one configuration from column D — four documented combinations cover the majority of field deployments.

Documented C × D Combinations

Four pairings seen across operating references

Each pairing exists because the chemistry demanded it — not because one configuration is universally superior:

(a) ZLD brine — Evaporative + FC: tolerates scaling, 0.2–0.8 mm salt
(b) Li₂CO₃ — Reaction + DTB >90 °C: inverse-solubility precipitation, fines destroyed
(c) NiSO₄ — Evaporative + Oslo: coarse 1–5 mm premium crystals at ≤1–2 g/L
(d) Fertilizer — Evaporative + DTB: 0.5–2.0 mm uniform granules, elutriated

If your system does not appear here, the method still comes from the solubility curve and the configuration still comes from the PSD target — the pairing is engineered, never catalogued.

Chemical Systems

Chemical Systems × Route × Configuration

Six systems with documented operating references. The route and configuration columns are the C and D decisions this page has built — read any row as a worked example of the two-dimension method.

SystemSolubility BehaviorRoute (C)Configuration (D)Key Constraint
Li₂CO₃BATTERY
Inverse — less soluble hot than coldReactionDTB >90 °CPrecipitation rate set by stoichiometry and temperature window
(NH₄)₂SO₄FERTILIZER
Steep positive slopeEvaporativeDTB 0.5–2.0 mmGranule uniformity for fertilizer blending
Adipic acidFINE CHEMICAL
Very steep — 2→160 g/L from 20→90 °CCoolingMulti-stage, ≤5–8 °C per stageStay inside the metastable zone — stage count from the curve
Lysine · MSG · citricFERMENTATION
Moderate positive slopeVacuum cooling flash35–55 °C, cycle <2 hNo cooling surface — broth fouls any exchanger
LiOH·H₂OBATTERY
Positive slope, viscous near saturationEvaporativeFC, tight ΔT controlViscosity rise limits supersaturation per pass
Pesticide mother liquorRECOVERY
Complex multi-soluteEvaporative + hybridFC, see mother liquor recoveryImpurity accumulation — purge strategy governs yield

Routes and configurations shown are documented operating practice, not exclusive choices. Figures reflect typical industrial ranges; project-specific selection requires solubility data and heat/mass balance.

Downstream

The Crystal Is Only Half the Product

Purity and moisture spec are won or lost after the crystallizer. Three downstream stages turn a slurry into saleable product.

01 · Separation & Washing

Centrifuge & Wash

Pusher, peeler or screen-bowl centrifuges dewater the slurry; a wash stage displaces mother liquor from crystal surfaces. Impurity carry-over is set here, not in the crystallizer.

>99.5%battery-grade purity achievable with effective wash displacement
02 · Drying

Fluid-Bed or Flash Dryer

Dryer selection follows crystal size and thermal sensitivity: fluid-bed for granular product, flash for fine. Overdrying wastes energy; underdrying cakes the product in storage.

<0.1–0.5%final free moisture — <0.1% battery, <0.5% fertilizer
03 · Mother Liquor

Recycle & Purge Strategy

Mother liquor returns to the front end until impurities concentrate to their limit — then a controlled purge keeps product purity stable. The purge ratio is a design variable, not an afterthought.

Purge ratioset by impurity accumulation — see mother liquor recovery
Technical Specifications

Crystallization System Envelope — Published Supplier Data

Indicative ranges aggregated from published supplier specifications of crystallizer and crystallization-train builders (FC, DTB and Oslo bodies; evaporative, cooling and vacuum routes). For route screening only — not a process guarantee for any specific project.

System SectionParameterPublished Indicative RangeApplies To / Basis
Product crystalPSD window by configurationFC 0.2–0.8 mm · DTB 0.5–2.0 mm · Oslo 1–5 mmDimension D sets the achievable band; published DTB product executions run 600–1,200 μm
Product crystalPublished salt cuts0.2–0.5 mm fine · 0.5–1.2 mm table · 1.2–2.5 mm coarsethree merchant-salt grades from published seeded crystallizer lines
Product qualityPurity (dry basis)NaCl ≥99.2% → 99.7–99.9% · battery-grade Li₂CO₃ >99.5%purification train plus washing; configuration alone does not reach the spec
Product qualityFinal free moisture≤0.2% published salt products · <0.1% battery-grade drying speccentrifuge + fluidized-bed drying; the drying step inherits every PSD decision
SupersaturationMetastable-window controlOslo bed ≤1–2 g/L · FC flash with heater ΔT ≤10 °Cseed addition and slurry-density control published across FC/DTB/Oslo executions
Vacuum-cooling routeOperating conditions2,000–4,000 Pa(abs) · final temperature 30–35 °C · residence 1.5–2.0 hpublished vacuum-cooling crystallizer data; below 40 °C energy rises steeply
Whole trainCapacity range0.05–0.2 t/h pilot continuous units · 0.5–2 t/h double-effect · 3–50 t/h triple-effect · salt plants 5–500 t/dpublished model ranges across builders, pilot to modular multi-train
Whole trainEnergy by drive routeMVR 15–40 kWh per t water · double-effect SE 1.8–2.2 · triple-effect SE 3.5–4.0 kg/kgenergy form follows site utilities, not the crystallizer body
Thermal profileEffect temperatures3-effect salt 99/76/53 °C · double-effect 80–90 / 55–70 °C · low-temp ladder ~80→40 °Cpublished multi-effect profiles feeding the crystallizer
Crystal slurrySlurry-density band15–30 wt% on classified-growth bodiesa primary lever on crystal size and PSD, held by loop design
FootprintContinuous vs batch route≈500 m² per 100 kt/y continuous-cooling execution vs ≈10,000 m² batch-kettle routepublished continuous organic-acid crystallization comparison
On-streamCIP interval≥10–20 days published salt-crystallizer CIP cyclesfouling service determines the real number

Ranges aggregate published specifications from crystallizer and crystallization-train builders (FC, DTB, Oslo and continuous-cooling executions). Figures are supplier-published indicative values for screening; a project number requires your solubility data across the operating range, target PSD and purity specification.

Main Process Modules

The Train, Module by Module

Each module is selected on feed chemistry and duty — the envelope column gives published operating ranges per module type, not a single-project specification.

ModuleEquipment TypesSelection BasisIndicative Operating Envelope
Feed conditioningBrine purification skid — softening / clarification / polishing filtrationliquor quality sets the purity ceilingpublished salt lines purify ahead of the effects
Pre-concentrationMulti-effect or MVR evaporator bodyapproach saturation inside the metastable zone3–50 t/h single-train evaporative duty
Supersaturation generationFlash vessel · vacuum-cooling · scraped surface · freeze / reaction injectionDimension C — the solubility-curve shape decidesvacuum-cooling: 2,000–4,000 Pa(abs) · 30–35 °C final · 1.5–2.0 h residence
Crystal growth bodyFC · DTB · OsloDimension D — PSD target vs feed difficultyFC 0.2–0.8 mm · DTB 0.5–2.0 mm · Oslo 1–5 mm
Fines managementBaffle-annulus elutriation (DTB) · classified bed (Oslo) · fines-dissolution loopkeep the PSD narrow; fines redissolved, not lostDTB baffle gap 0.5–1 m/s classification field
Solid–liquid separationThickener → peeler / pusher centrifugecrystal size and slurry density set the machinepusher class 1100 mm basket · >80 t/h on coarse salts
Washing & dryingFluidized-bed / vibration dryer + screeningpurity and moisture targetsfinal free moisture ≤0.2% published salt products
Mother liquorClosed-loop return to the effects · purge bleed · by-product outletyield vs impurity accumulationsecondary mother liquor sold as by-product on published food-grade lines

Module envelopes follow the published supplier data above; supersaturation set point, fines-loop rate and purge are project-specific and set at design.

Crystallization in the Field — Case Studies & Technical Guides

Preliminary Screening Only

Crystal size, purity and moisture figures on this page are indicative ranges from operating references, not a process guarantee. Real selection requires your solubility data across the operating temperature range, target PSD distribution, purity specification and utility context. Screen against measured data, not catalog figures.

FAQ · Engineering Answers

Crystallization Questions We Answer Most

Recurring questions from engineers screening a crystallization route for the first time.

QHow do I choose between FC, DTB and Oslo?

By target particle size and impurity tolerance. FC delivers d50 0.2–0.8 mm at 2–3 m/s circulation and tolerates the highest supersaturation — the scaling-brine workhorse. DTB delivers 0.5–2.0 mm with an elutriation leg destroying fines — fertilizer and battery chemicals. Oslo delivers 1–5 mm by fluidized-bed classification at ≤1–2 g/L supersaturation — coarse premium product. Purity spec then confirms or vetoes the shortlist.

QWhen is cooling crystallization the wrong route?

When the solubility curve is flat — cooling barely reduces solubility, so yield collapses and the energy spent on refrigeration buys nothing. Then evaporative crystallization (or vacuum flash, which cools and concentrates simultaneously) is the only route to the yield target. Adipic acid sits at the opposite extreme: 2 to 160 g/L from 20 to 90 °C, where cooling is the natural route.

QWhy does lithium carbonate use reaction crystallization above 90 °C?

Li₂CO₃ has an inverse solubility curve — it is less soluble hot than cold, so neither cooling nor vacuum flash can precipitate it from a hot pregnant liquor. Sodium carbonate is dosed into the lithium-bearing solution above 90 °C, and the product leaves solution as it forms. DTB with fines destruction holds the particle size inside the battery-grade window.

QCan crystallization combine with MVR or multi-effect evaporation?

Yes — and it usually should. The evaporation front end (Dimension A) pre-concentrates to near saturation; the crystallizer (Dimensions C and D) then generates supersaturation and grows product. MVR pre-concentrator plus FC crystallizer back end is a documented ZLD pattern; the energy strategy and the crystallization decisions are orthogonal and pair freely. See the ZLD solution line.

QHow do I hit battery-grade purity above 99.5%?

Three levers in sequence: fines control in the crystallizer (DTB elutriation removes the impurity-rich fine fraction), wash displacement on the centrifuge (clean wash liquor displaces mother film from crystal surfaces), and mother-liquor purge strategy (impurities never concentrate past their limit). The dryer contributes nothing to purity — it only protects what the upstream stages won.

Screening a Crystallization Route?

Send us solubility data across the operating range, target particle size, purity spec and throughput. We will return a preliminary method + configuration screening with indicative yield — not a brochure.

Request a Proposal

Send your feed characterization (TDS, COD, main salts, viscosity), throughput and product targets — we respond with a preliminary process route within two business days.