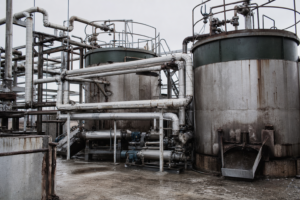
Roughly 30% of industrial crystallization projects fail because of improper scale-up — not bad chemistry, not bad crystallizer selection, but the uncontrolled jump from laboratory vessel to industrial reactor (an industry-reported failure rate). The reason is geometric: moving from a 1-liter beaker to a 10 m³ industrial crystallizer multiplies volume ten-thousand-fold, and neither mixing efficiency nor supersaturation distribution scales linearly with size. The consequences arrive as three classic loss-of-control modes — crystal size distribution (CSD) drifting out of specification, fouling and blockage, and energy consumption overrunning design. The defense that works is a staged validation ladder — laboratory (1–100 L) to pilot (100–1000 L) to industrial — run with the right tools at each stage; this article maps the ladder, the sizing rules for each rung, the crystallizer-type decisions that interact with scale, and the five mistakes that account for most failures.
Why Scale-Up Fails: Mixing Does Not Scale
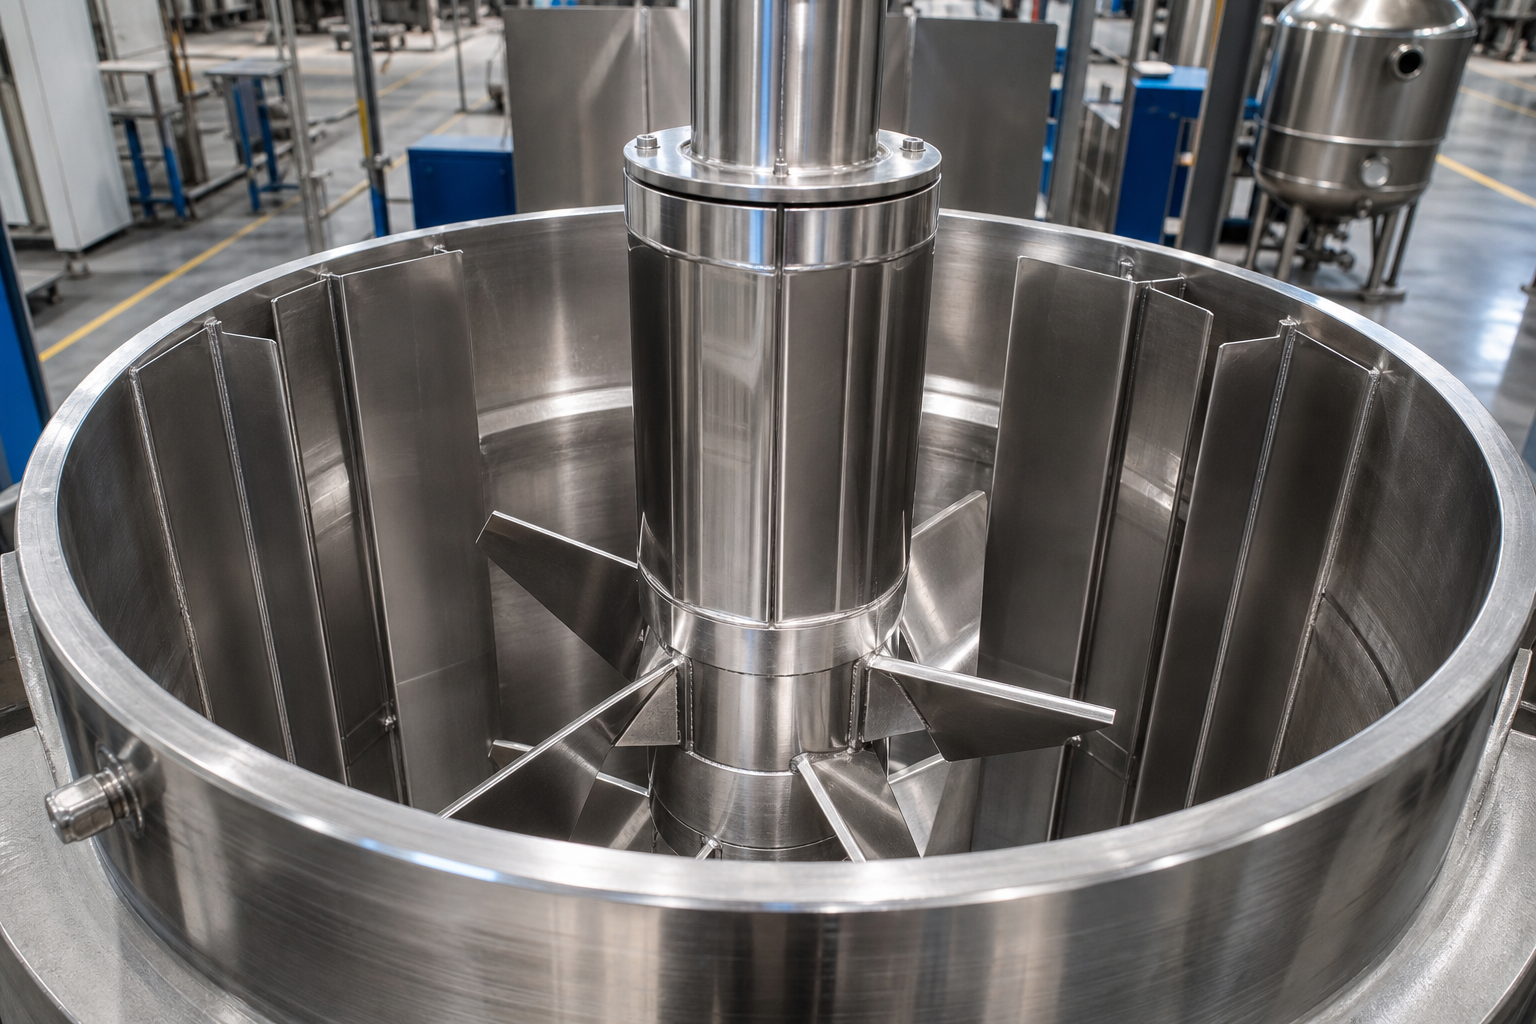
The heart of the problem is that a crystallizer is a supersaturation machine, and supersaturation is created locally. In a laboratory vessel, a small agitator turns the whole volume over quickly; supersaturation generated at the cooling surface or evaporation zone disperses almost uniformly, and crystals grow in a homogeneous environment. In an industrial vessel, the same nominal power input per volume leaves dead zones where liquor stagnates and over-concentrates, and hot spots where growth conditions differ from the bulk — the industrial DTB mixes with characteristic dead zones where the laboratory version mixed uniformly, and transfers heat with gradients where the laboratory version was effectively isothermal. Crystals sampled from different regions of the same industrial vessel have lived through different histories, and the CSD records that fact.
The second nonlinearity is residence time and thermal accumulation. Scaling from 5 L/h to 5,000 L/h can add as little as three extra seconds of holdup in the wrong thermal zone, and for sensitive products — whey proteins, plant extracts (illustrative applications) — three seconds is enough to initiate browning or scorching that the laboratory campaign never showed. Field statistics reported in external industry references sharpen the warning: a majority of production incidents trace to circulating heat-accumulation effects in high-viscosity materials being ignored during design, and a significant share of pilot failures are associated with insufficient hot-spot sensor coverage. Scale-up is a sensing problem as much as a geometry problem.
The Three-Stage Validation Ladder
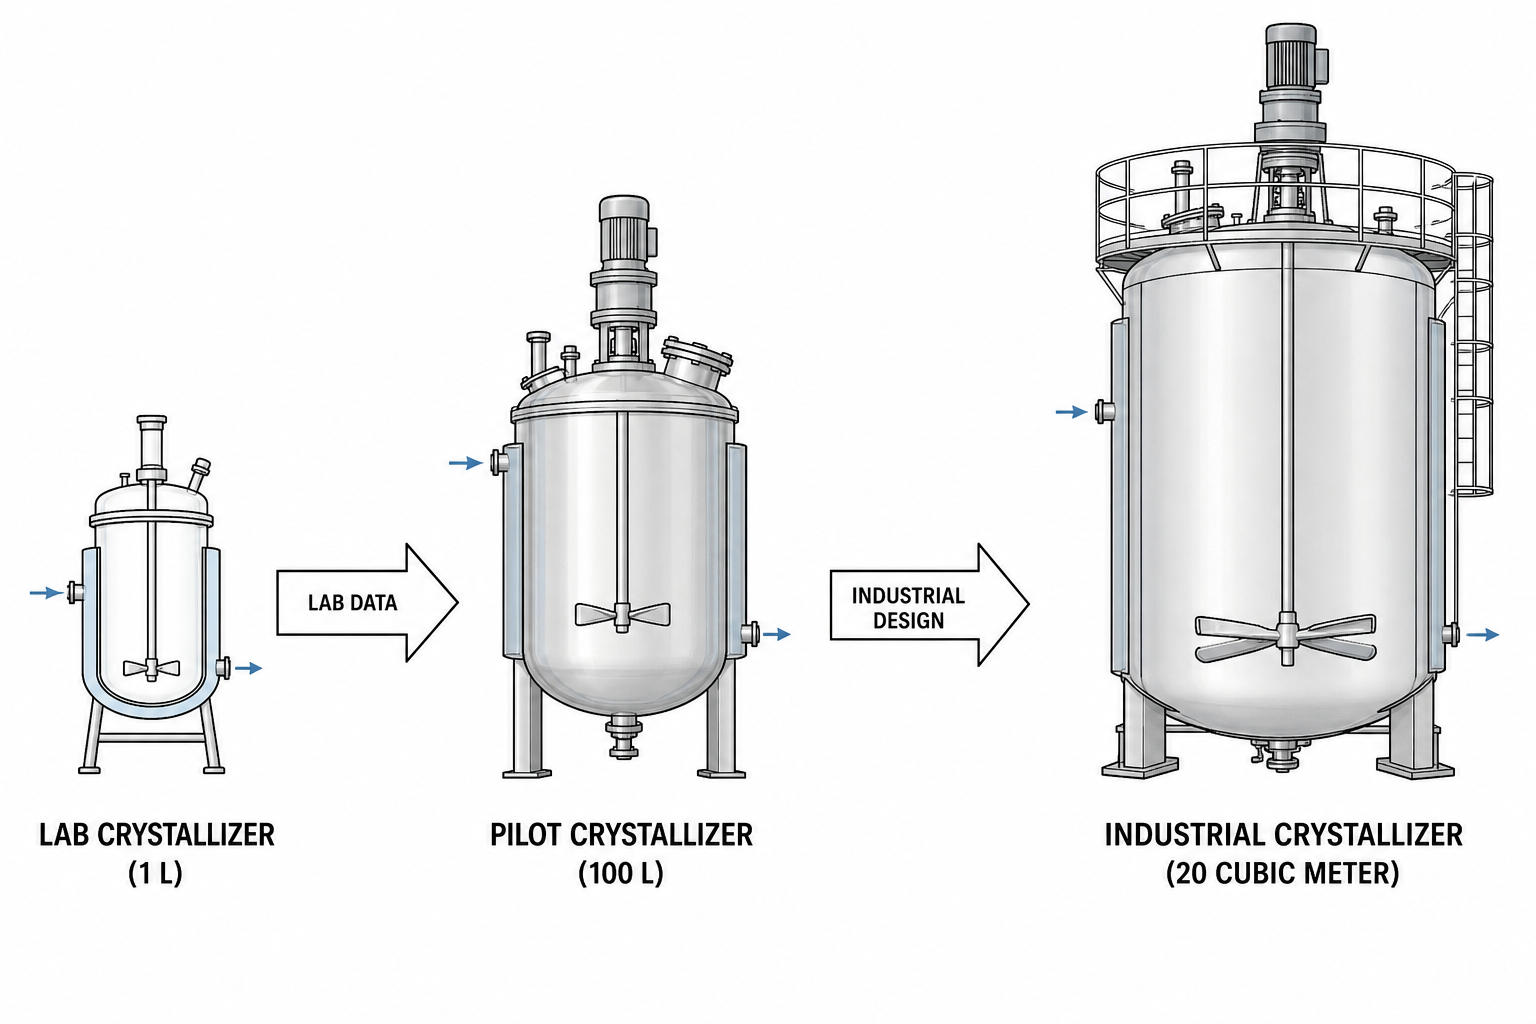
Mature practice divides development into three stages, each with distinct goals and exit criteria, with an overall timeline of six to eighteen months.
| Stage | Working volume | Core tasks | Duration |
|---|---|---|---|
| Laboratory | 1–100 L | Solubility curves, metastable zone width (MSZW) measurement, habit modification and seed strategy, thermodynamic feasibility | 1–3 months |
| Pilot | 100–1000 L | Hydraulic and mixing verification, fouling rates, materials exposure, control-loop tuning, energy modeling | 3–6 months |
| Industrial | Full scale | Five-point verification: pump power-capacity matching, evaporator fouling rate, mother-liquor recovery efficiency, supersaturation automation, compliance data package | 2–9 months to stable operation |
Discipline at each stage buys accuracy at the next: with a properly executed ladder, operating deviations are held to about ±5% between pilot prediction and industrial reality, and MVR temperature-lift design lands within about 3% on energy (reported outcomes, not guarantees). The laboratory stage’s signature failure-avoider is metastable-zone mapping: an API plant (external industry reference) that measured MSZW properly caught a polymorph transition risk and controlled it by pH adjustment before it ever reached a production batch.
The Pilot Sizing Rule: 1:10 to 1:20
Pilot plants fail by being too small to be honest. The working rule from industrial practice: the industrial-to-pilot scale ratio should sit between 1:10 and 1:20 — a target 10 t/h industrial crystallizer needs a pilot of 500–1,000 kg/h before the hydraulics, circulation patterns, and heat-accumulation behavior it measures are representative of the full-scale machine. Below that ratio, a pilot demonstrates chemistry but proves nothing about mixing; the data looks convincing and scales wrongly, which is worse than no data because it displaces the caution that honest ignorance would have provided.
What Pilot Testing Must Catch Before Capital Is Committed
Four catch-categories define pilot exit criteria. Thermal: circulating heat accumulation in high-viscosity liquor — the dominant root cause — must be measured, not assumed, which requires dense temperature sensing of the circulation loop. Fouling: the evaporator section’s fouling rate on real liquor sets the CIP design and the availability assumption in the economics. Materials: a meaningful share of pilot systems exhibit pitting or stress-corrosion cracking within their first 500 hours (industry-reported) — the pilot is the cheapest place to discover that 316L was the wrong call, and material verification therefore belongs inside the pilot loop, not after it. Energy: the pilot’s measured specific energy consumption becomes the zero-error baseline that the industrial machine is contractually compared against — a dual mission of validating, for example, ultra-low-vacuum falling-film stability while establishing the SEC benchmark.
Choosing the Crystallizer With Scale-Up Eyes
Crystallizer geometry decides how gently the machine creates supersaturation and how it classifies the crystals it grows — and each of the three main families carries a distinct scale-up signature. Target crystal size is the primary selector: below roughly 0.4 mm, forced circulation; 0.5–2 mm, DTB; above 2 mm, OSLO.
| Type | Typical product size | Scale-up risk signature | Energy character |
|---|---|---|---|
| Forced circulation (FC) | ~10–300 μm fines-tolerant, robust | Pump cavitation and power mismatch at scale; heat accumulation in the circulation loop | Circulation pump can exceed 40% of total cost of ownership |
| DTB (draft-tube baffle) | ~0.5–2 mm, controllable CSD | Short-circuiting between draft tube and baffle zone at scale, fines destruction drift | Moderate; impeller-driven |
| OSLO (fluidized bed) | >2 mm large uniform crystals | Fluidized-bed collapse when scaled geometry under-sizes the classification zone | 15–30% higher than DTB due to fluidization duty |
Read the risk column as the pilot’s homework assignment: an FC pilot must instrument its circulation loop; a DTB pilot must verify fines-destruction behavior at representative circulation; an OSLO pilot must prove the bed stays fluidized through turndown. The three geometries are profiled in depth on the forced-circulation, DTB, and OSLO crystallizer pages, and the supersaturation logic common to all of them on crystallization.
The Five Classic Scale-Up Mistakes
Failure records compress into five recurring errors. First, copying laboratory parameters verbatim: agitation speed, cooling rate, and seed loading from a 5-liter vessel transplanted into 10 m³ — the single most common origin of CSD collapse. Second, ignoring fluid mechanics: the OSLO bed collapse and the DTB short-circuit both belong to this family, preventable by CFD analysis of the scaled geometry before fabrication. Third, underestimating fouling: laboratory campaigns on filtered, clean liquor meet real mother liquor at industrial scale, and impurity accumulation suppresses crystal growth into fines and centrifuge blockage — impurity effects on MSZW are systematically underestimated and rank as a leading root cause of failed start-ups. Fourth, ignoring energy: the FC circulation pump that quietly becomes 40%-plus of lifecycle cost, or the MVR temperature lift that misses its duty point — energy belongs in the pilot’s measurement plan, not in the first month’s utility bills. Fifth, skipping the stability test: a process that produces specification crystals for eight hours has proven a point, not a plant; extended runs at the pilot stage are what convert chemistry into a process.
Digital Tools and the Modern Process Package
The validation ladder is now instrumented end to end. Process analytical technology (PAT) measures what the laboratory could only infer: ATR-FTIR and FBRM probes track supersaturation and particle counts in real time, inline Raman detects polymorph, and turbidity flags nucleation events. CFD simulation predicts dead zones and short-circuiting in the scaled geometry before steel is cut. At the digital frontier, digital-twin pilots have caught design errors with direct money attached — a European pharmaceutical project’s twin (external industry reference) revealed pump energy consumption well above design, avoiding substantial annual electricity overruns — and edge-AI gateways now build live models that predict full-scale specific energy consumption, warn of equipment failure up to 48 hours ahead, and support remote Factory Acceptance Testing.
Materials Verification in the Pilot Loop
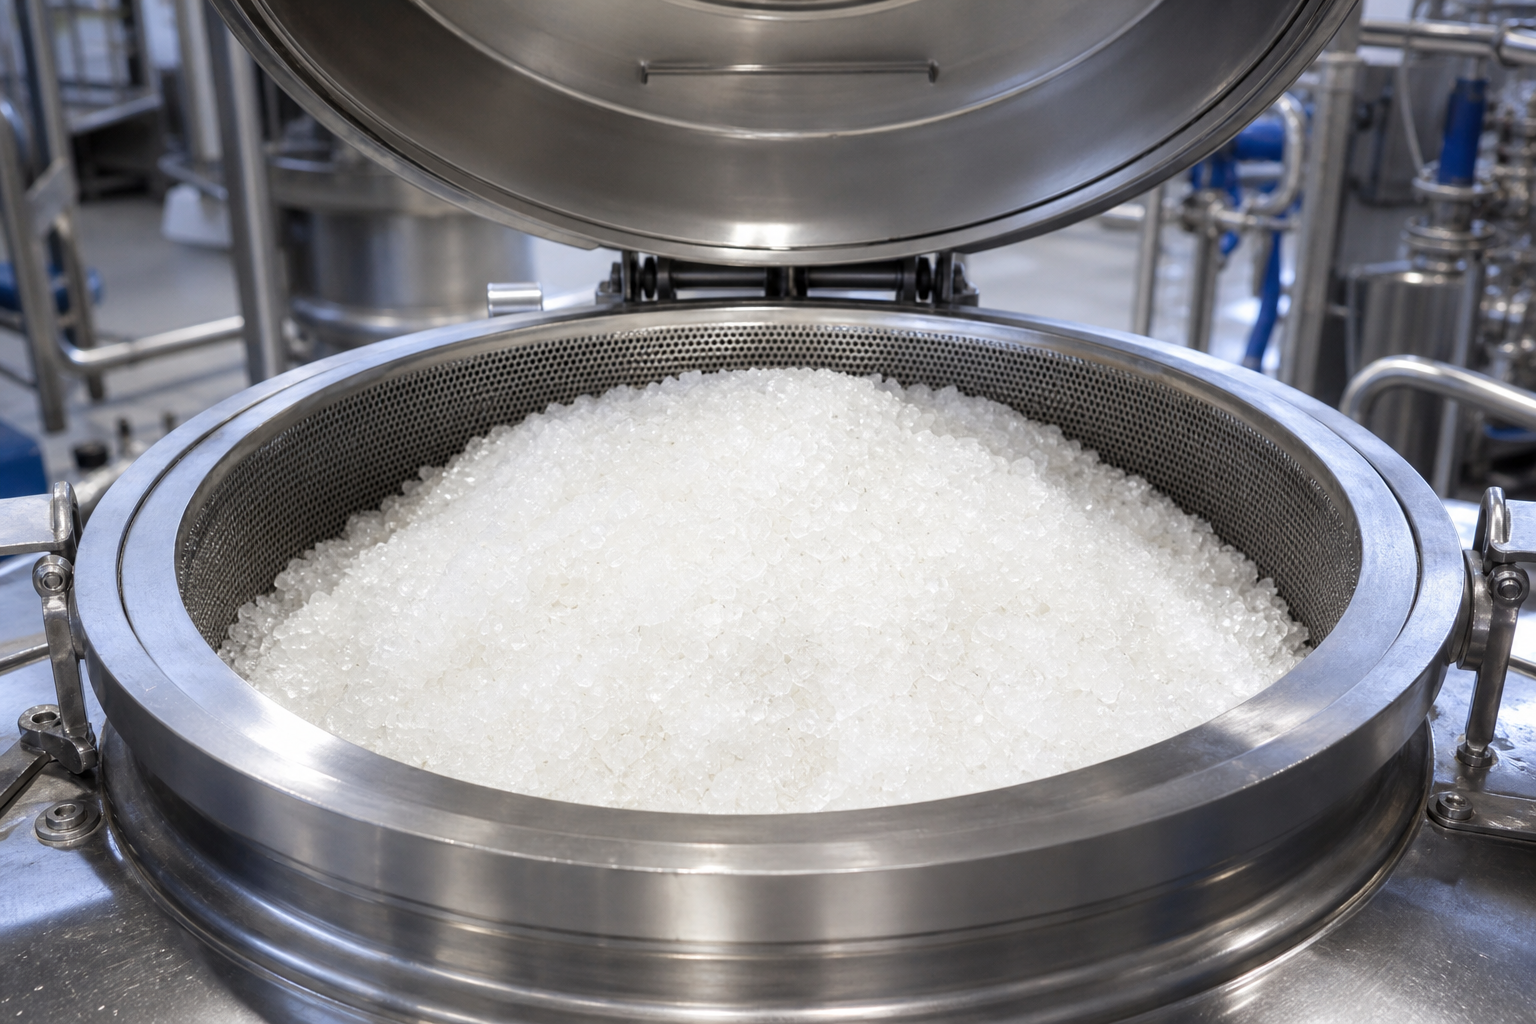
Corrosion data earns its place in the pilot report through the pitting-resistance-equivalent number (PREN) ladder — a stainless-steel metric (PREN = Cr + 3.3Mo + 16N): 316L sits around 25, duplex 2205 around 35 — and, beyond where PREN applies, titanium (TA2) and nickel alloys such as Hastelloy C276, which are selected for hot concentrated chloride duty by their own corrosion logic rather than by PREN, with cost climbing roughly 1.8–8× along the same ladder. The selection rule that pilot exposure validates: chloride levels above 20,000 ppm at temperatures above 80°C point to 2205 duplex or titanium, whose 10–15-year service life offsets a two-to-three-times capital premium. The full materials-selection logic is laid out in construction materials and corrosion protection.
From Process Package to Modular Delivery
A modern process package compresses the ladder into deliverables: concept design with Aspen-based mass and energy balances and multi-scenario thermal simulation; a pilot campaign of 200–500 L on real feedstock running 72 hours continuous — validating anti-fouling design, D50 particle size, and 2205/titanium corrosion behavior; then 3D modular skid fabrication, with factory completion of pressure testing and instrument commissioning cutting installation from roughly two months to two weeks. The delivery logic of that last step is covered in skid-mounted and modular evaporation systems. A reference execution (external industry reference): a 50 L to 5,000 L pharmaceutical API scale-up combined FBRM-measured MSZW, CFD-tuned FC pump speed, and PAT-automated control to hold yield essentially flat across the scale jump.
FAQ
Why do crystallization projects fail at scale-up?
Three mechanisms dominate: crystal size distribution drift (mixing and supersaturation no longer uniform at 10,000× volume), fouling and blockage (real mother liquor meets surfaces that laboratory liquor never stressed), and energy overruns (pump duty and temperature lift mispredicted). Roughly 30% of industrial crystallization projects fail for scale-up reasons — almost always traceable to skipping or under-sizing the pilot stage.
How big should a pilot crystallizer be?
One-tenth to one-twentieth of industrial scale — the 1:10–1:20 rule. A 10 t/h industrial target needs a 500–1,000 kg/h pilot before hydraulics are representative. Smaller pilots prove chemistry but their mixing data misleads at full scale, which is riskier than no data.
How long does crystallization process development take?
Six to eighteen months end to end: laboratory 1–3 months (solubility, MSZW, seeding), pilot 3–6 months (hydraulics, fouling, materials, control), and industrial commissioning 2–9 months to stable operation. Compressing the pilot stage is where the 30% failure statistic is earned.
Which crystallizer type is easiest to scale up?
Forced circulation is the most forgiving geometry — high circulation velocity suppresses tube boiling and tolerates solids — but watch its pump energy, which can exceed 40% of lifecycle cost. DTB scales well with CFD-verified draft-tube hydraulics for 0.5–2 mm products; OSLO demands the most scale-up respect because an under-sized classification zone collapses the fluidized bed, and it carries 15–30% higher energy than DTB.
What should pilot testing measure before we commit capital?
Four categories: thermal (circulating heat accumulation with dense hot-spot sensing — most production incidents trace to ignoring it), fouling rate on real liquor (sets CIP design and availability), materials exposure (pitting or stress corrosion shows up early in many pilot systems), and specific energy consumption (the contractual baseline for the industrial machine).